SpaGene Ligand–Receptor Colocalization Analysis Training Guide
Introduction
IMPORTANT
SpaGene is a tool designed to identify ligand–receptor (L–R) pairs that are spatially proximate within tissues, with a focus on spatial transcriptomics and spatial proteomics datasets. By combining spatial neighborhood statistics with permutation testing, SpaGene quantifies the strength and significance of ligand–receptor colocalization, helping researchers quickly shortlist candidate signaling molecules supported by spatial proximity.
In spatial omics studies, co-expression alone is insufficient to suggest potential intercellular communication; spatial proximity provides essential supporting evidence. SpaGene integrates expression and spatial distance, computes a colocalization score and significance for each candidate L–R pair, and supplies a high-confidence candidate list for downstream communication modeling (e.g., CellChat_spatial, COMMOT) or experimental validation.
Core Features of SpaGene
- Ligand–receptor colocalization scoring: Quantifies spatial proximity and statistical significance for each L–R pair.
- Permutation testing and multiple testing correction: Generates an empirical background distribution to report P-values and FDR.
- Configurable spatial neighborhoods: Supports radius- or k-nearest-neighbor-based neighborhoods to accommodate different spatial resolutions.
This guide provides a comprehensive overview of SpaGene, covering theoretical foundations, step-by-step operation on the SeekSoul™ Online cloud platform, result interpretation, practical case studies, best practices, and frequently asked questions, so you can efficiently carry out ligand–receptor colocalization analyses.
SpaGene Theoretical Foundations
The core idea of SpaGene is to evaluate whether the spatial proximity of a candidate ligand L and receptor R exceeds random expectation within a spatial coordinate system. The typical workflow includes:
- Candidate pair generation: Filter ligand–receptor pairs expressed in the dataset from built-in or user-provided databases (with configurable expression thresholds).
- Spatial neighborhood definition: Construct spatial neighborhoods based on coordinates (fixed radius r or k nearest neighbors) to obtain potential interacting cell/spot pairs.
- Colocalization score calculation: For each L–R pair, quantify the co-occurrence of high L and high R expression within neighborhoods (e.g., using weighted adjacency or distance decay).
- Permutation testing: Randomly permute cell labels or gene labels to build a background distribution and compute P-values and FDR.
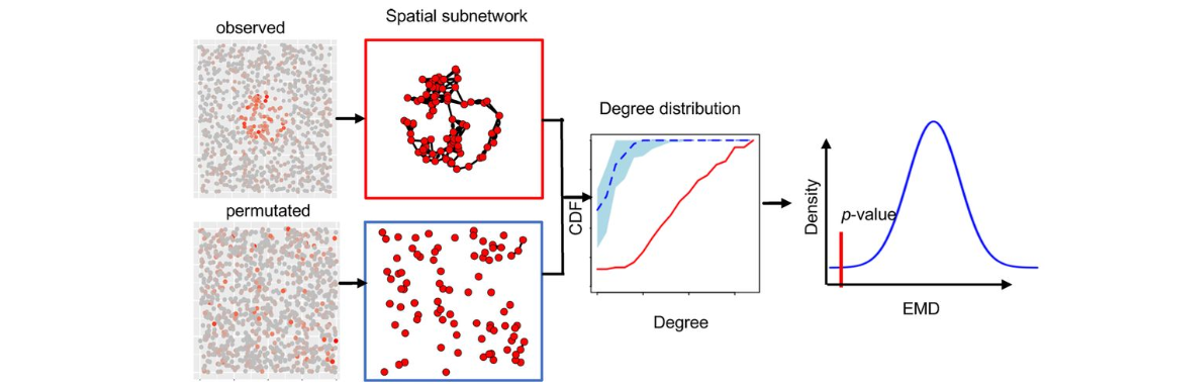
Figure: SpaGene analytical pipeline. Candidate L–R pairs are filtered, spatial neighborhoods defined, colocalization scores computed, and permutation testing applied to assess significance, with optional comparisons across multiple conditions.
Key Methodological Highlights
Spatial neighborhood construction
- Radius-based: Define neighbors as cells/spots within distance r.
- k-NN: Select the k nearest neighbors for each cell/spot.
- Distance weighting: Optionally assign higher weights to closer neighbors.
Expression thresholds and binarization
- Define “high expression” for L and R via percentiles or absolute thresholds.
- Stricter thresholds lower false positives but may reduce sensitivity.
Significance assessment
- Permutation strategies: permute cell labels, gene labels, or spatial coordinates to construct the null distribution.
- Multiple testing: adjust FDR across large numbers of L–R pairs to control the overall false-positive rate.
SeekSoul™ Online Platform Operation Guide
On the SeekSoul™ Online cloud platform, SpaGene is provided as an intuitive workflow—no coding required. Configure the parameters and submit your job.
Parameter Configuration
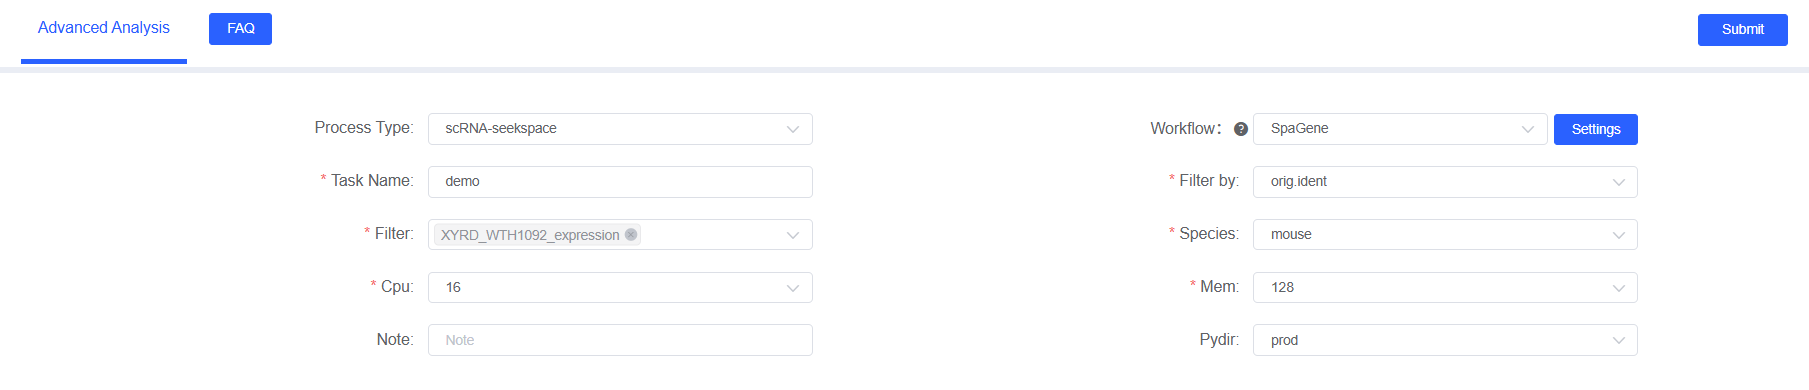
In the “Advanced Analysis” module, choose “SpaGene” and supply the following parameters:
Basic Parameters
Task Name
- Description: Name of the analysis task.
- Format: Must start with a letter; letters, numbers, underscores, and Chinese characters are allowed.
- Example:
SpaGene_analysis
Filter by
- Description: Metadata column containing sample identifiers.
- Examples:
Sample,GD.N_A.
Filter
- Description: Sample IDs selected from the filter column.
- Examples:
A15,sample1.
Species
- Description: Choose the species for the selected samples.
- Options:
humanormouse.
Remarks
- Description: Optional free-text notes.
Operation Steps
- Open “Advanced Analysis” and select the “SpaGene” module.
- Choose sample and species.
- Submit the job and wait for completion.
- Download and review the HTML report and exported data files.
Result Interpretation
SpaGene generates a report containing visualizations and tables. Key outputs include:
Ligand–Receptor Spatial Expression Map
Image Example: Top1_LR_coexpression.png
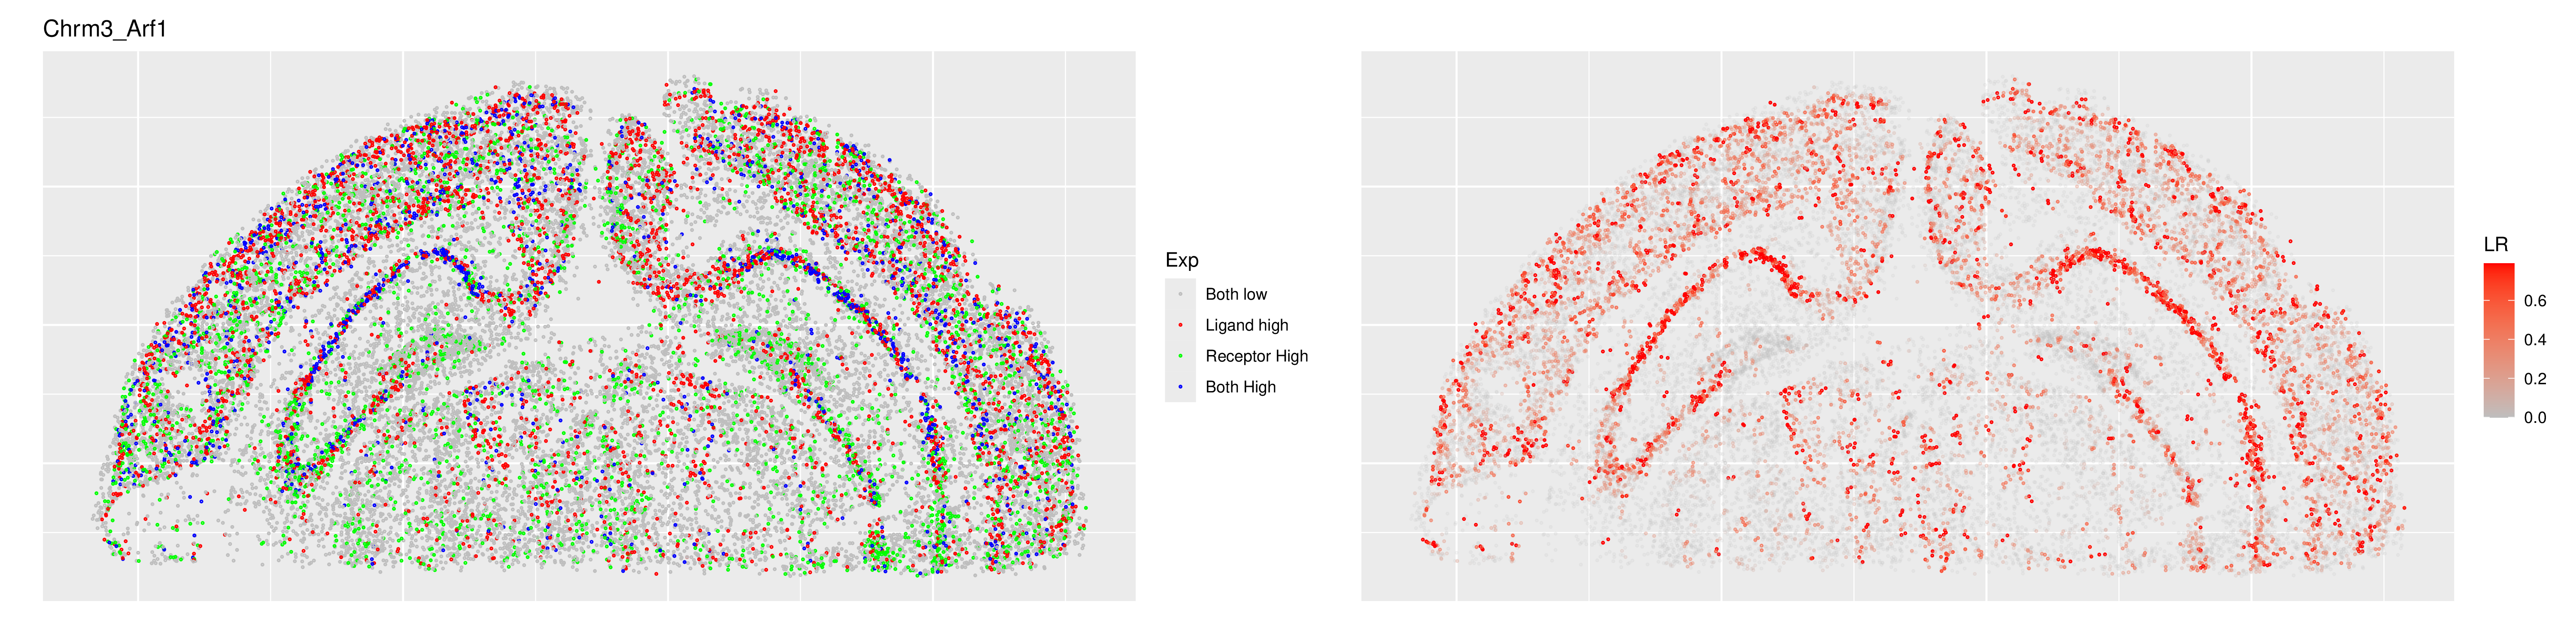
How to read it:
- Left panel (expression typing): Gray indicates both ligand and receptor are low; red indicates ligand-high/receptor-low; green indicates receptor-high/ligand-low; blue indicates both high. Blue hotspots usually mark potential colocalization regions—combine with cell-type annotations to pinpoint candidate populations.
- Right panel (colocalization score): Color intensity reflects the colocalization score or local interaction strength; higher values mean the L–R pair is more spatially proximate than random expectation in that region.
- Integrated interpretation: Focus on regions where the left panel shows blue clusters and the right panel shows elevated scores, then cross-check with neighborhood radius, sample stratification, and literature evidence for secondary validation.
Reference Example: NPC TLS (Figure 5f) Interpretation
Image Example: NPC_TLS_Fig5f.png
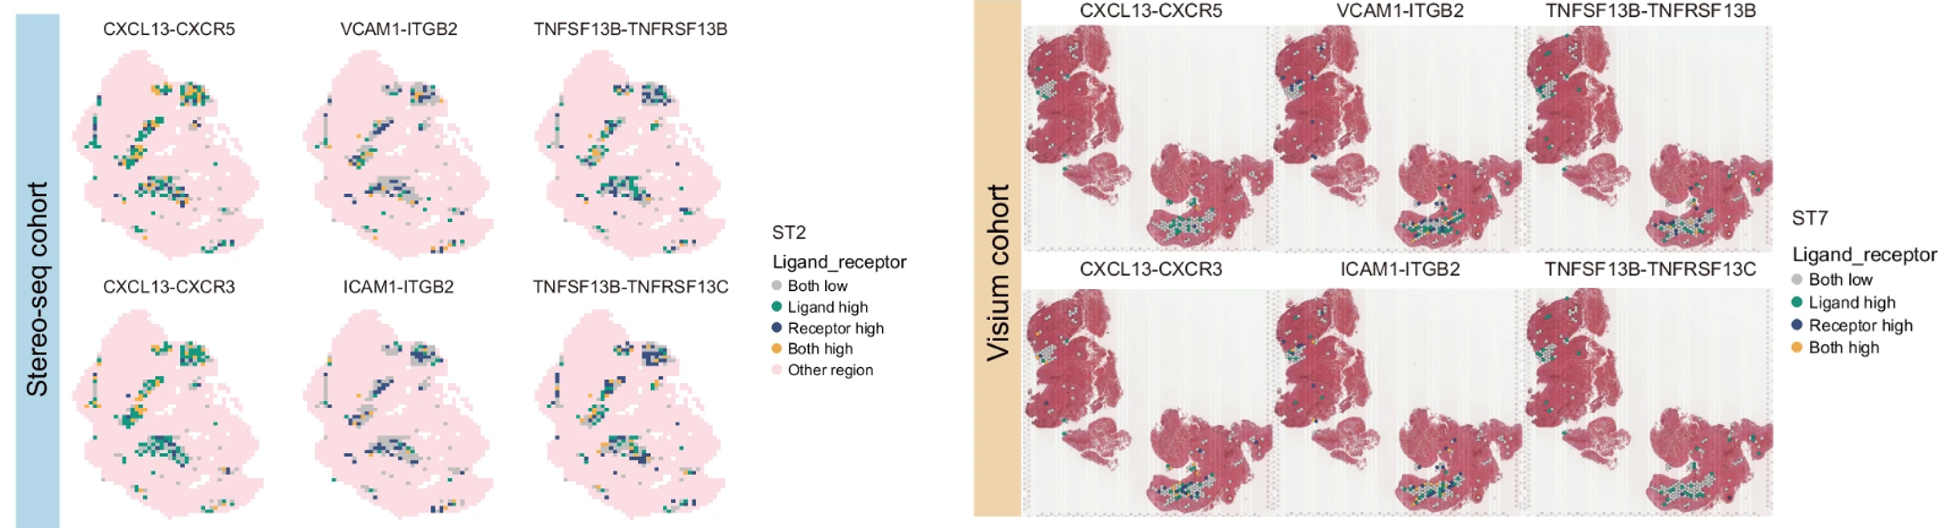
Figure 5f: Demonstrates spatial hotspots of key L–R axes (e.g., CXCL13–CXCR5) within tertiary lymphoid structures (TLS) in nasopharyngeal carcinoma. High-expression ligand and receptor regions are colored differently; hotspots reveal the co-local enrichment of B cells and T follicular helper (Tfh) cells, supporting TLS formation and humoral activation.
Exported Tables
| File Name | Description |
|---|---|
LR_coexpression.txt | Ligand–receptor co-expression table |
Top1_LR_coexpression.png | Ligand–Receptor Spatial Co-expression Map |
TIP
Suggested reading order: Start with the Manhattan plot to identify significant L–R pairs, then examine heatmaps/spatial distributions to locate key hotspots, and finally consult tables for quantitative values supporting downstream analyses or experimental design.
Case Studies
Case 1: TLS-Related Colocalization in Nasopharyngeal Carcinoma
- Context: Identify TLS-associated ligand–receptor pairs in nasopharyngeal carcinoma, focusing on spatial colocalization among CXCL13⁺ cancer-associated fibroblasts, CXCL13⁺ CD8⁺ T cells, B cells, Tfh cells, and mature plasma cells.
- Data: Nasopharyngeal carcinoma spatial transcriptomics (combined single-cell and spatial analysis).
- Findings: SpaGene reveals significant colocalization of CXCL13–CXCR5 within TLS regions (FDR < 0.01). CXCL13⁺ CAFs co-localize with B cells and Tfh cells, facilitating B-cell adhesion and antibody production and activating CXCL13⁺ CD8⁺ T cells. Plasma cells mature via germinal center reactions and spatially colocalize with tumor aggregates; antibody–Fc receptor interactions score highly at tumor–immune interfaces, supporting EBV⁺ tumor cell apoptosis.
- Implication: Highlights the spatial organization of TLS communication, links TLS signatures to prognosis and PD-1 blockade response, and underscores the role of spatially proximate L–R interactions in reinforcing immunotherapy efficacy.
SpaGene Result Snapshot
Figure 5f: TLS hotspots of key L–R axes (e.g., CXCL13–CXCR5). Distinct colors mark high ligand vs. high receptor populations, with hotspots indicating the co-local enrichment of B cells and Tfh cells—an evidential chain for TLS-driven humoral immunity.
Notes and Best Practices
WARNING
- Spatial colocalization ≠ causal communication: Spatial proximity offers only supportive evidence—combine with expression magnitude, pathway knowledge, and functional validation.
- Resolution and mixing effects: Spot-level data may contain mixed cell populations; consider deconvolution or validate findings at single-cell resolution.
- Parameter sensitivity: Neighborhood radius/k, expression thresholds, and permutation counts can markedly affect results; perform sensitivity analyses.
TIP
Best Practices
- Cross-validate with COMMOT/CellChat_spatial and prioritize L–R pairs significant in both spatial and communication models.
- Standardize preprocessing and annotations to minimize batch effects when comparing across samples.
- Use spatial visualizations (scatter, kernel density, zoomed-in views) to inspect hotspots.
- Combine multi-sample replication and literature evidence to increase confidence in candidates.
Frequently Asked Questions (FAQ)
Q1: Can SpaGene detect lowly expressed ligands or receptors? A: Lowly expressed genes are less likely to yield stable spatial signals. Set stringent expression thresholds or focus on known strong candidates to reduce false positives.
Q2: How should I choose the neighborhood radius r or k? A: Tune parameters according to tissue size and spatial resolution. Single-cell imaging data typically use smaller r or k values.
Q3: Why might SpaGene results differ from other communication tools? A: SpaGene emphasizes spatial proximity, whereas other tools may focus on expression levels or pathway modeling. Cross-validate and focus on overlaps among methods.
References
- GitHub:
https://github.com/liuqivandy/SpaGene - Liu Q., Hsu C.-Y., Shyr Y. Scalable and model-free detection of spatial patterns and colocalization. Genome Research, 2022.
- Liu Y., Ye S. Y., He S. et al. Single-cell and spatial transcriptome analyses reveal tertiary lymphoid structures linked to tumour progression and immunotherapy response in nasopharyngeal carcinoma. Nature Communications 15, 7713 (2024).
Summary
SpaGene offers a standardized, statistically rigorous workflow for ligand–receptor spatial colocalization analysis. When combined with tools such as COMMOT or CellChat_spatial, researchers can triangulate evidence from spatial proximity and communication modeling to identify functional interactions and guide spatial imaging or functional experiments.